Graph in MATLAB
To plot the graph of a function, you need to take the following steps −
Define the function, y = f(x)
Call the plot command, as plot(x, y)
Let us plot the simple function y = x for the range of values for x from 0 to 100, with an increment of 5.
x = [0:5:100];
y = x;
plot(x, y)

Now plot the function y = x2. In this we will draw two graphs with the same function, but in second time, we will reduce the value of increment. Please note that as we decrease the increment, the graph becomes smoother.
x = [1 2 3 4 5 6 7 8 9 10];
x = [-100:20:100];
y = x.^2;
plot(x, y)

MATLAB allows you to add title, labels along the x-axis and
y-axis, grid lines and also to adjust the axes to spruce up the graph.
·
The xlabel and ylabel commands generate labels along x-axis
and y-axis.
·
The title command
allows you to put a title on the graph.
·
The grid on command
allows you to put the grid lines on the graph.
·
The axis equal command
allows generating the plot with the same scale factors and the spaces on both
axes.
·
The axis square command generates a square plot.
x = [0 : 0.01: 10];
y = sin(x);
g = cos(x);
plot(x, y, x, g, '.-'), legend('Sin(x)', 'Cos(x)')

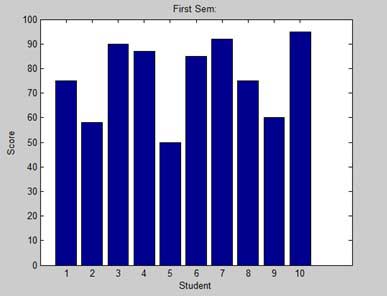
Bar Charts
The bar command draws a two dimensional bar chart. Let us take up an example to demonstrate the idea.
x = [1:10];
y = [75, 58, 90, 87, 50, 85, 92, 75, 60, 95];
bar(x,y), xlabel('Student'),ylabel('Score'),title('First Sem:')
print -deps graph.eps
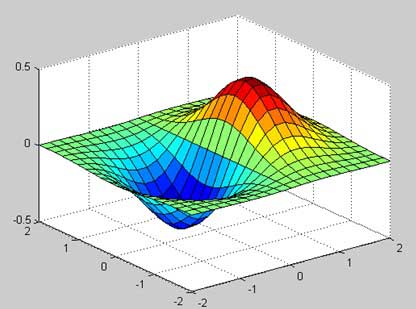
Three Dimensional Plots
Three-dimensional plots basically display a surface defined by a function in two variables, g = f (x,y).
As before, to define g, we first create a set of (x,y) points over the domain of the function using the meshgrid command. Next, we assign the function itself. Finally, we use the surf command to create a surface plot.
[x,y] = meshgrid(-2:.2:2);
g = x .* exp(-x.^2 - y.^2);
surf(x, y, g)
print -deps graph.eps
No comments:
Post a Comment